You may spend hours choosing, editing, compressing, naming, and adding alt text to your travel photos. Then, once the post is published, you probably judge those photos through the performance of the page.
If the article gains traffic, the images seem to have done their job. If it doesn’t, they appear to have made little difference.
The problem is that pageviews don’t tell you how someone found the page. A trail photo may help a hiking guide appear in Google Images. A landscape may support a Discover appearance. A vertical itinerary graphic may get saved on Pinterest and send someone to your blog weeks later.
Those are three different types of discovery, and they leave different traces in your data.
To measure travel photo performance, look at three stages:
- Visibility: Did the page, photo, or Pin appear?
- Response: Did someone click, open, or save it?
- Useful action: Did the resulting visit help the traveler take another relevant step?
Keep each platform separate while using the same three questions. An impression in Google Images isn’t the same as a Discover impression or a Pinterest impression, so adding them together would create a large but fairly meaningless number.
The scorecard in this guide is therefore a decision sheet, not a universal image score. It helps you see where your travel photography creates discovery, where that discovery stops, and what you may want to improve next.
Table of Contents
What does it mean for a travel photo to create discovery?
A useful travel photo can perform several jobs.
It may answer a visual question, such as what a hiking trail looks like in late spring. It may help a traveler recognize a ferry terminal before arriving. And it can show whether a beach is sandy, whether a viewpoint has a barrier, or how exposed a mountain route feels.
Sometimes that usefulness also creates measurable discovery. The image, page, or Pin appears somewhere, earns a response, and brings the traveler closer to the information they need.
Here is what that journey looks like across the main visual channels:
| Channel | Visibility signal | Response signal | Useful action | Main limitation |
|---|---|---|---|---|
| Google Images | Image-search impressions | Image clicks and CTR | A relevant action on the landing page | Search Console usually reports the page, not the exact photo |
| Google Discover | Discover impressions | Discover clicks and CTR | Continued reading or another planning step | The report is page-based and cannot prove which image caused the appearance |
| Pin impressions | Saves, Pin clicks, and outbound clicks | A useful action after an attributable visit | Pinterest metrics describe Pins and shouldn’t be compared directly with Google | |
| Your blog | Attributable landing sessions, when available | Engagement with the page | Map, itinerary, related-guide, affiliate, or signup action | GA4 may not cleanly separate every Google Images or Discover visit |
Not every photo needs to bring a click. A transport image may mainly reassure someone already reading the guide. A personal photo may establish that you visited the place. Others make the story enjoyable, memorable, or easier to trust.
The scorecard measures discovery where the platforms provide evidence. It doesn’t decide whether a photo deserves to exist.
Build one scorecard, but don’t create one blended image score
It’s tempting to place every image-related metric in one dashboard and calculate a total. I wouldn’t do that.
Google Images responds to a search, while Discover recommends content based on people’s interests. Pinterest can support immediate clicks, but it also helps travelers collect ideas for a trip they may take months later.
Even the word “impression” means something different in each environment. Pinterest defines an impression as a Pin or ad appearing on screen. Google counts impressions according to the rules of its own search and discovery surfaces. A total of 5,000 Pinterest impressions and 5,000 Google Images impressions doesn’t mean the same thing happened twice.
Use one structure, but keep three separate scorecards:
| Stage | Question to answer |
|---|---|
| Visibility | Did the page, photo, or Pin get seen? |
| Response | Did people click, open, or save it? |
| Useful action | Did the visit lead to a next step that suits the page? |
I would then give each page or creative a simple result label:
- Working: visibility and the intended response are moving in a healthy direction.
- Exposure without visits: the content appears, but it rarely earns a click or outbound visit.
- Visits without action: the visual brings people in, but the page doesn’t help them continue.
- Emerging: the sample is small, although the early direction looks encouraging.
- Unclear: the data or attribution is too limited for a useful decision.
These labels aren’t grades. A Pinterest Pin can be “working” because it earns saves, while a Google Images result for the same post remains “exposure without visits.” Each result describes the job of that channel.
Step 1: measure Google Images discovery in Search Console
Google Search Console gives you the clearest starting point for image-search visibility.
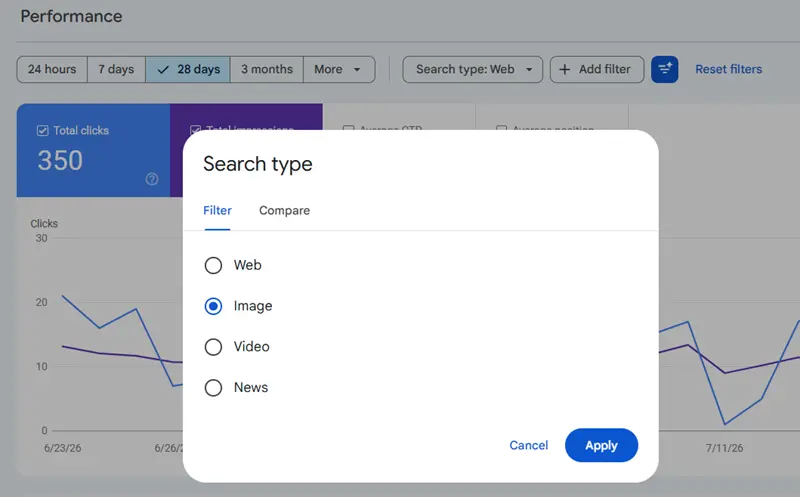
Open Performance → Search results, then:
- Click Search type at the top of the report.
- Select Image and apply the filter.
- Choose a meaningful date range.
- Open the Pages tab to find the landing pages receiving image impressions and clicks.
- Review the Queries tab to see the searches linked with that visibility.
- Record impressions, clicks, CTR, average position, and the direction of change.
Google’s Performance report guidance confirms that the search-type filter can separate web, image, video, and news results.
For a seasonal destination, compare matching periods whenever the data allows it. An ice-skating guide and a summer island guide shouldn’t be judged against the same months. My guide to comparing travel-content performance with destination demand explains how to choose a fairer seasonal baseline.
Read the page and its queries together
The page report tells you where image visibility lands. The query report helps explain the visual needs behind it.
Suppose a coastal guide gains impressions for searches about ferry arrivals, harbor sunsets, beach umbrellas, and water taxis. That tells you more than the total impression count alone. Google appears to connect the page with several visual parts of the trip: arrival, transport, scenery, and beach planning.
You can group queries into practical subject categories, such as:
- viewpoints and panoramas
- beaches and swimming conditions
- hiking trails and route surfaces
- local food
- ferries, stations, and other transport details
- maps and itineraries
- hotel rooms and accommodation areas
- clothing, festivals, and cultural details
The groups don’t need to match a keyword-research template. They should reflect what someone may want to see.
These patterns can guide future photography, too. If travelers repeatedly search for the condition of a trail, another generic mountain panorama may add less value than a close view of the surface, signs, exposed sections, or junctions.
However, treat the visible query list as a sample. Google omits some low-volume queries to protect privacy while keeping them in the chart totals. Its explanation of Search Console data filtering calls these anonymized queries. Therefore, query groups can reveal themes, but they usually cannot show the exact share of all image impressions.
Two seasonal image-discovery patterns from the same travel blog
I tested this method with two photo-heavy posts from my personal travel blog, Happiness Is My Direction:
- an Ischia travel guide based on my summer experience on the island
- a personal post about ice skating on Lake Runn in Sweden.
I don’t run Happiness Is My Direction as an SEO project, and I don’t use it to test a publishing formula. It’s a passion project I created for fun. I keep its Search Console property because the data occasionally shows me how people find the stories and photos.
Between December 1, 2025, and March 31, 2026, the two pages received similar levels of Google Images visibility:
| Page | Image impressions | Image clicks | Image CTR | Average position |
|---|---|---|---|---|
| Ischia travel guide | 2,868 | 0 | 0% | 60.8 |
| Lake Runn ice-skating post | 2,490 | 1 | 0.04% | 43.2 |
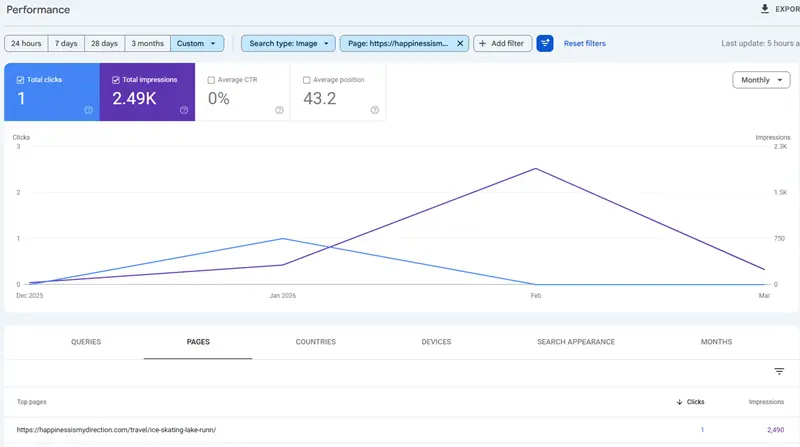
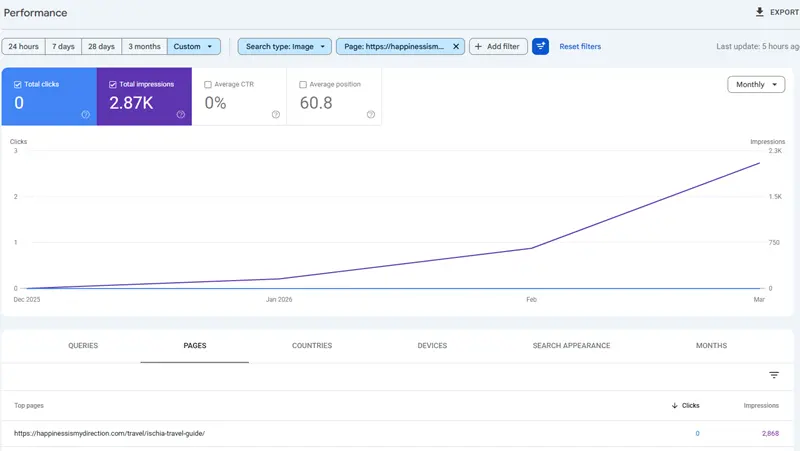
This isn’t a performance contest. The destinations, seasons, queries, and roles of the posts differ. The interesting part is when the impressions appeared.
| Month | Ischia image impressions | Lake Runn image impressions |
|---|---|---|
| December 2025 | 3 | 32 |
| January 2026 | 158 | 318 |
| February 2026 | 657 | 1,894 |
| March 2026 | 2,050 | 246 |
About 76% of Lake Runn’s image impressions appeared in February. Its visibility then fell sharply and stopped after March 4. Ischia moved in the opposite direction: roughly 72% of its impressions arrived in March as spring and the summer-planning season approached.
The pattern fits the subject of each page. Lake Runn is about a winter activity that depends on safe frozen-lake conditions. Ischia is a summer destination guide covering beaches, food, transport, and places to visit.
Still, seasonality is an interpretation, not proof of the cause. Search rankings, indexing, result layouts, and changes in demand may all influence the curve. The right conclusion is that seasonal context matters, not that the calendar explains every impression.
The query data adds another layer. Lake Runn’s overall average image position was 43.2, but the page appeared around position 8–9 for “lake runn ice skating” and “falun ice skating.” An average across every query can hide much stronger visibility for a few highly relevant searches.
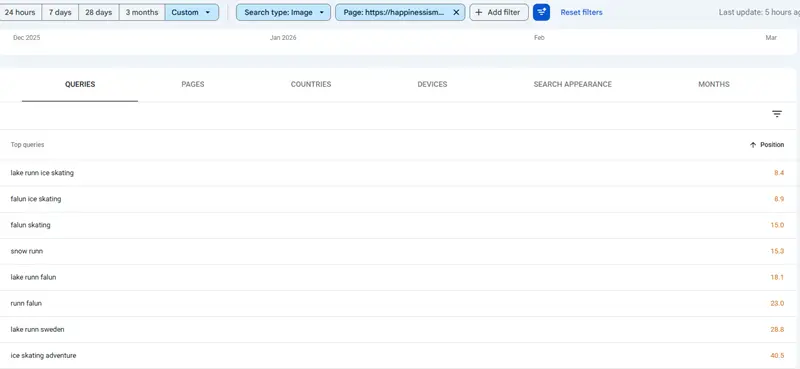
Ischia’s visible queries covered a broader set of subjects, including:
- Ischia Porto, the harbor, arrivals, and the bus station
- beach umbrellas and summer scenes
- Castello Aragonese and sunset views
- boats, coastal roads, and hidden coves
Search Console links those themes with the landing page. It doesn’t tell me which exact Ischia photo appeared for each search.
Don’t claim more than Search Console shows
Google Images performance is normally easiest to interpret at page, query, subject, destination, or page-format level.
If a guide contains 25 photos, Search Console may show that the page earned impressions for “Ischia Porto bus station.” It won’t necessarily identify the file that appeared. You can look at the page and make a reasonable guess, but a guess remains a guess.
This limitation also changes what you should improve. Don’t replace the most attractive photo because the page has a low image CTR. First, inspect the queries and live image results. The problem may involve low positions, a weak page-query match, an unhelpful crop, or a subject that competitors show more clearly.
If Google seems to misunderstand the subject, review the nearby copy, caption, filename, and alt text. Google’s image SEO guidance explains how page content and image details help it understand the subject. My guide to writing clearer alt text for travel photos covers that part in more detail.
Step 2: treat Discover as page-level visual exposure
You may not see a Discover report in Search Console. Google only shows it when a property reaches a minimum impression threshold.
That is the case for Happiness Is My Direction, so I can’t use either travel post as a personal Discover example. The missing report doesn’t mean the photos failed. It means there isn’t enough reported Discover data for this part of the scorecard.
When the report is available, record:
- impressions
- clicks
- CTR
- landing page
- country
- weekly or monthly pattern
- whether the page appeared again.
Use a longer view when possible. Discover can produce a sudden spike that disappears as quickly as it arrived. Google describes Discover traffic as less predictable than keyword-driven search traffic, so I wouldn’t use one strong day as a new baseline for an evergreen guide.
Separate association from attribution
A Discover report proves that the page received impressions or clicks. It doesn’t prove that one exact photo created them.
The preview image likely affected how the result looked. However, the subject, headline, timing, user interests, page quality, and other signals also influenced distribution.
I find three evidence labels useful here:
- Documented: Search Console shows that the page received Discover impressions or clicks.
- Observed: several pages with a similar image style or format repeatedly appear.
- Hypothesis: a specific image, crop, or composition helped the result.
You can act on a hypothesis, but label it honestly. For example, you might test a more representative main image on future destination guides. Don’t turn one Discover appearance into a rule that every featured image must copy.
Google recommends relevant, high-quality images for Discover, including large images that are at least 1,200 pixels wide. Its guidance also warns against generic, text-heavy, misleading, or exaggerated previews. Those are useful checks, but they don’t guarantee distribution.
Step 3: measure Pinterest by the job of the Pin
Pinterest is optional. You don’t need to open an account simply to complete an image-performance scorecard.
If you already publish there, the platform can show a different type of travel discovery. Someone may save a destination idea long before they are ready to read a full guide. Another person may click straight through because a practical itinerary matches a trip they are planning now.
Pinterest defines its main analytics metrics as follows:
- Impressions: the number of times a Pin or ad appeared on screen.
- Saves: the number of times people saved the Pin to a board.
- Pin clicks: clicks that opened the Pin in close-up.
- Outbound clicks: actions that led to a destination outside Pinterest.
- Save rate: saves divided by impressions.
- Outbound click rate: outbound clicks divided by impressions.
Choose the response metric according to the Pin’s job.
A scenic image designed to inspire a future trip may create value through saves. A “three days in Ischia without a car” Pin should probably earn outbound clicks if it promises a practical itinerary on the blog.
Compare Pins that lead to the same page
Pinterest gives you a better chance to compare individual creatives than Google Images or Discover.
For one destination guide, you could compare:
- a landscape photo with a vertical collage
- a landmark with a route map
- a scenic image with a practical text overlay
- two photos that use the same headline and landing page
Keep the dates, organic or paid filter, audience context, and destination page as consistent as possible. Even then, call it a comparison rather than a controlled experiment. The Pins may have appeared at different times or reached different users.
If you publish Pins yourself, add UTM parameters to their destination links. You can then review campaign sessions, engagement, and relevant actions in GA4.
UTMs improve attribution for owned Pins. They don’t identify every repin, later return, or cross-device visit, so the numbers still need some caution.
Step 4: check what visitors do after arrival
A visit isn’t automatically a successful outcome. The traveler should be able to do something that fits the reason they opened the page.
“Post-entry action” simply means that useful next step. It doesn’t need to be a purchase.
| Travel page type | Possible useful action |
|---|---|
| Photo essay or inspiration post | Open a destination guide, save an itinerary, or join the newsletter |
| Hiking guide | Open a route map, conditions source, transport section, or related trail |
| Itinerary | Continue to accommodation, transport, attraction, or booking details |
| Food guide | Open the map, restaurant details, or a neighborhood guide |
| Hotel or tour comparison | Visit a relevant provider or affiliate partner |
Define the action before checking the data. Otherwise, it’s easy to collect every scroll, click, and event that looks positive without asking whether it helped the reader.
When you can identify image-led sessions, use: useful action rate = useful actions from attributable image-led sessions ÷ attributable image-led sessions × 100
This works best for a tagged Pinterest campaign. Attribution becomes weaker for Google Images and Discover because GA4 will likely not isolate those visits cleanly.
What my two examples can and cannot show
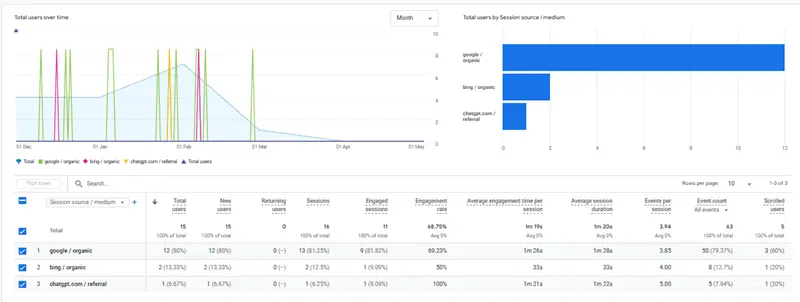
The Lake Runn post received 13 Organic Search sessions (Google) in GA4 from December through March. Ten were engaged sessions, and visitors averaged 86 seconds of engagement per organic session.
Search Console recorded only one Google Images click during the same period. I can say that the page attracted and engaged a small organic audience. I can’t claim that its photos brought all 16 sessions or caused their engagement.
GA4 also recorded one engaged chatgpt.com / referral session. That visitor spent about 1 minute and 21 seconds actively engaging with the page. It’s a nice example of the post being discovered through another source, but it doesn’t belong in the Google Images scorecard.
The Ischia guide shows the same distinction. Between December 2025 and May 2026, it received two Organic Search sessions. Both were engaged, both visitors scrolled, and their average engagement time was 5 minutes and 20 seconds.
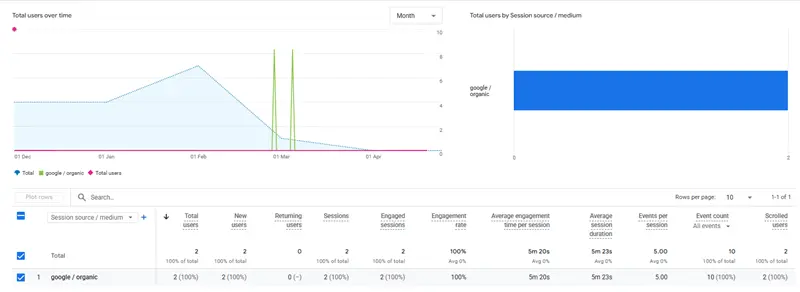
However, Search Console recorded no Google Images clicks during that broader period. I can therefore say that the guide held the attention of its small organic audience. I cannot say that image search brought those visitors.
Visibility, acquisition, and engagement describe different stages. One cannot stand in for another.
Step 5: look for patterns beyond one photo or post
One successful image can be an accident. A repeated pattern is far more useful.
Once you have reviewed several pages or Pins, label them by:
- Destination: Ischia, Madeira, the Dolomites, Corsica, and so on
- Photo subject: landmark, landscape, viewpoint, trail, food, transport, map, room, event, or people
- Page format: itinerary, hiking guide, seasonal story, things-to-do list, photo essay, review, or comparison
- Image origin: first-hand, commissioned, or stock
- Format: horizontal, vertical, square, collage, map, or annotated visual
Then ask:
- Which destinations gain image visibility more than once?
- Which subjects earn clicks or saves?
- Do practical photos perform differently from scenic ones?
- Which page types turn visual discovery into continued planning?
- Does one crop work well on Pinterest but poorly as a Discover preview?
- Do first-hand images show a stronger pattern than stock photos on your own site?
Don’t assume original photography will always win. First-hand images can offer details that stock libraries miss, but performance also depends on the query, topic, season, page, presentation, and competing results.
The goal is to find what your audience repeatedly uses. If ferry photos, route maps, and trail conditions keep creating discovery, you have evidence to capture more of them on future trips. If landscape photos attract visibility but few visits, they may still support the article without becoming your main acquisition strategy.
How to interpret your travel-image scorecard
The scorecard becomes useful when it leads to a decision.
| Pattern | What it may mean | What to do next |
|---|---|---|
| Google Images impressions and clicks rise | The page is gaining search-led visual discovery | Protect what works and expand related visual coverage |
| Image impressions rise but clicks stay weak | The page appears, but the result isn’t earning visits | Inspect queries, positions, live results, subject, crop, and page match |
| Pinterest saves rise but outbound clicks stay low | The Pin has planning or inspiration value, but gives little reason to visit | Review the Pin’s promise and the bridge to the article |
| Pinterest outbound clicks rise but useful actions stay weak | The creative earns visits, but the page or audience fit may be weak | Check message match, page structure, and the visibility of the next step |
| One Discover spike appears and doesn’t return | The page received temporary exposure | Record it without treating it as stable performance |
| Several pages with the same subject perform well | A repeatable visual need may exist | Capture more first-hand examples and connect the related pages |
| Google Images is weak while Pinterest is strong | The content may suit saved planning better than image search | Judge each channel by its intended job |
| Every channel has little data | There isn’t enough evidence yet | Extend the period, group related pages, and avoid a large redesign |
If impressions rise but clicks don’t, avoid jumping straight to image optimization. A page ranking around position 60 has a different problem from a page ranking near the top with weak CTR.
Likewise, unexpected queries aren’t automatically irrelevant. They may reveal a visual need you hadn’t considered. Read the search intent before deciding whether to strengthen or remove that association.
A practical travel-image scorecard template
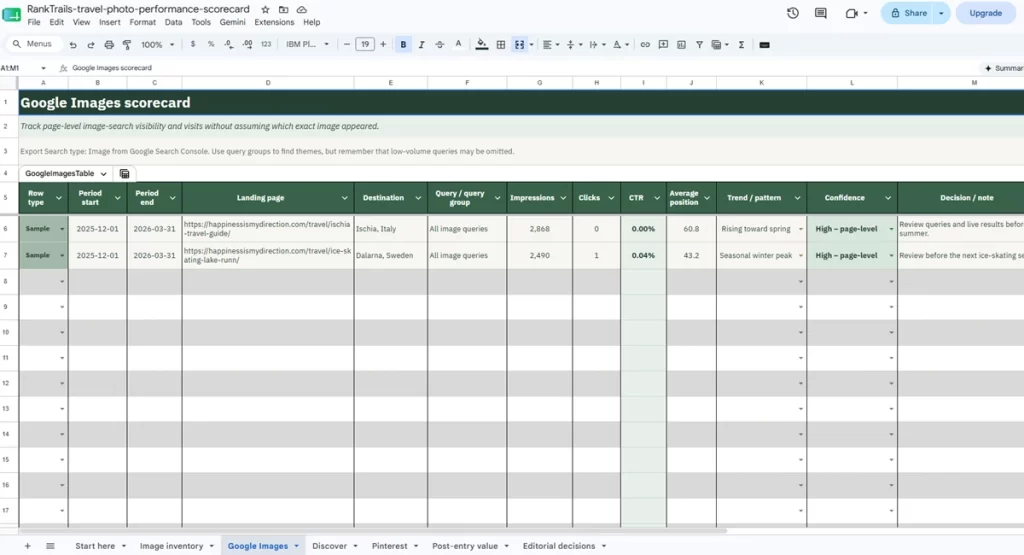
You don’t need to build the scorecard from scratch. You can download my free Travel Photo Performance Scorecard workbook and adapt it to your own blog.
The workbook includes separate tabs for Google Images, Discover, Pinterest, post-entry value, image inventory, and editorial decisions. Built-in formulas calculate key rates, while dropdowns help you evaluate the evidence and select your next action. I’ve also added sample entries for the Ischia and Lake Runn posts to show how each section works.
Each channel remains separate, so the workbook won’t combine unrelated metrics into one misleading score.
How often should you review travel photo performance?
There is no useful universal schedule for every channel.
Review active Pinterest campaigns monthly or after they have collected enough data to compare. Review Google Images over longer periods, especially if your posts cover seasonal destinations. For Discover, a monthly review is enough when the report exists, but don’t overreact to isolated spikes.
Use the same number of completed days when comparing periods. If a summer season is still underway, compare it with the same completed dates from the previous year.
Avoid universal CTR benchmarks, too. A result’s position, query, country, device, season, and format all affect the rate. Your page’s history and intended job usually provide a fairer benchmark than a number taken from an unrelated website.
What the image-performance scorecard cannot tell you
This method gives you better evidence, but it won’t assign exact credit to every photo.
- Search Console often reports Google Images performance through the landing page rather than the image file.
- Discover reporting is page-based and cannot prove which preview image caused a click.
- The Discover report appears only after a minimum impression threshold.
- Google and Pinterest impressions aren’t comparable units.
- UTMs improve Pinterest attribution, but they don’t capture every later or indirect visit.
- GSC clicks and GA4 sessions use different measurement systems and won’t always match.
- A useful action after an image-led visit doesn’t prove that the image alone caused the decision.
- The topic, headline, season, query, page quality, and image may all contribute to the result.
Photos also provide context, trust, accessibility, and a sense of place when they create no measurable discovery.
Treat the scorecard as evidence for better editorial decisions, not a way to calculate the exact revenue or value of each travel photo.
Final thoughts
Travel photography deserves more than an upload checklist and a quick alt-text review.
Ask where a page, photo, or Pin appeared. Then look at the response it earned and what happened after the visit. Keep Google Images, Discover, Pinterest, and other sources separate, even when they all lead to the same guide.
Your most valuable travel photo may not be the one that looks best on the page. It may be the one that helps the right traveler find the right guide and take a useful next step.
FAQs about measuring travel photo performance
Select Image as the search type in Google Search Console to see Google Images impressions and clicks. For Pinterest, review outbound clicks and use tagged links for Pins you publish. Discover remains page-level because its report doesn’t identify the exact image.
Not reliably. Search Console generally connects image-search performance with the landing page. Queries and page content can suggest the likely subject, but they don’t always identify one image file.
Start with image impressions, clicks, CTR, average position, query relevance, landing-page trend, and a page-appropriate next action. Read them together instead of judging a photo through one number.
It depends on the Pin’s job. Saves can show inspiration or future-planning value. Outbound clicks matter more when the Pin should bring someone to an itinerary, guide, or comparison.
You can confirm that a page received Discover impressions and clicks. However, Search Console doesn’t prove that one exact photo caused the appearance or visit.
Search Console and GA4 use different measurement systems. Consent choices, tracking setup, session rules, and attribution can all create differences. GA4 may also group image-led visits with other organic traffic.